How to Read Your Rice Purity Test Score Chart
Published: November 1, 2026
Updated: November 1, 2026
You finished the test, and now you have a number. Maybe it is 82. Maybe it is 47. Either way, the next step is usually the same: you look up a score chart and wonder what your number actually means.
A score chart is a simple reading aid. It takes your single number and places it in a rough band, so you can see where it sits on the 0 to 100 scale. That is all it does. It is not a grade, not a diagnosis, and not a report on who you are. This guide explains how to read a rice purity test score chart without overthinking it.
How Your Score Is Calculated
The math is refreshingly simple. You start at 100, and you lose one point for every box you check.
- A score of 100 means you checked none of the 100 items.
- A score of 0 means you checked all 100 items.
- A score of 77 means you checked 23 items.
That is why the scale feels upside down at first. A higher number means fewer listed experiences checked, and a lower number means more checked. The number alone never tells you which items were checked, or what those experiences meant to you. Two people with the same score can have completely different answers.
The Score Chart, Band by Band
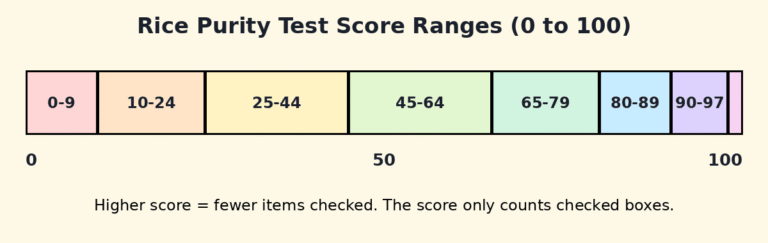
No single chart is official. Different quiz sites draw their bands in slightly different places and use different labels. Still, most charts group scores roughly like this:
| Score range | What it roughly means |
|---|---|
| 90 to 100 | Very few listed experiences checked |
| 70 to 89 | A handful of common social and relationship experiences |
| 50 to 69 | A broader mix of checked experiences |
| 30 to 49 | Many listed experiences checked |
| 0 to 29 | Nearly all or all listed experiences checked |
Read these bands as loose descriptions, not as categories you belong to. A score of 69 and a score of 70 are almost identical, even though a chart may put them in different bands. The boundary lines are made up by individual sites, and they are not standardized anywhere.
Also remember that every chart is tied to one question list. Scores only compare fairly when everyone took the same 100 questions. Comparing a score from one site with a score from a different list is like comparing two different quizzes.
Why Different Charts Label the Same Score Differently
If you search for a chart, you will notice that one site calls 70 to 89 one thing and another site calls it something else. That is normal, and it is not a mistake you need to solve.
There is no central authority that sets official score ranges. Each site creates its own bands and labels, so the same score can land under a different label depending on where you look. Treat chart labels as rough shorthand. The number itself, and how many boxes you checked, matters more than the label a site sticks on it.
What Your Score Does Not Tell You
This is the most important part of reading any chart. Your score counts checked boxes on one list. It does not measure:
- Your character or morals
- Your maturity or kindness
- Your intelligence or popularity
- Your health or safety
- How good a friend or partner you are
A low score is not a failing grade, even though a low number on a 0 to 100 scale can feel that way. A high score is not proof of good judgment either. It only means fewer items on that particular list were checked. The test has never been a validated psychological instrument, so it cannot tell you anything clinical about yourself, and it cannot predict your future.
Is There a Normal Score or an Official Average?
There is no official average score, and there is no normal score in a scientific sense. Some quiz sites publish averages based on their own anonymous submissions, and those figures are often reported informally online. But those submissions are self-selected: they come only from people who chose to take that site’s quiz and share a result. They are not a representative sample of all test takers.
So if you see an average quoted online, take it lightly. It may be interesting as a rough snapshot of one site’s visitors, but it is not a benchmark you should measure yourself against. Your age, your background, your timing in life, and even which version of the list you took all shift the number. Scores also tend to fall over time, simply because new experiences happen and the count can only stay the same or go down when you retake the test.
A Short History Behind the Chart
The chart makes more sense once you know where the test came from. The Rice Purity Test began in 1924 as an informal survey published in The Rice Thresher, the student newspaper at Rice University in Houston, Texas. That original version was a short ten-question survey of 119 female undergraduate students, not the 100-question checklist we know today.
Over the following decades, the Thresher revisited and expanded the idea, often on its satirical back page, and the list grew much longer. The 100-question version is a later iteration that became widely popular online. Knowing this history helps put the chart in perspective: it is a student tradition that kept changing, not a fixed scientific scale.
How to Use Your Score Chart in a Healthy Way
Here is a light, practical way to use your result:
- Look at the band, then look past it. The band is a rough guide, not a verdict.
- Count your checked boxes if you want a clearer picture. Your score subtracted from 100 tells you exactly how many items applied.
- Compare with friends only if everyone is comfortable, and only on the same question list. Keep it a conversation starter, not a ranking.
- Keep your individual answers private unless you choose to share them. Nobody needs your full list to understand your score.
- Let the number stay small in your mind. It is a tally of one list at one point in time, and you are not a tally.
The Bottom Line
A rice purity test score chart turns a count into a rough band. It can help you make sense of your number, but it cannot judge you, rank you, or sum you up. Read it lightly, compare less, and enjoy it for what it is: a fun, informal snapshot, not a verdict.
If you have not taken the test yet, or you want to retake it on the same list, you can take the Rice Purity Test on our homepage and then come back to this guide to read your new score.
Frequently Asked Questions
How do I read a rice purity test score chart?
Find your score on the 0 to 100 scale. A score near 100 means very few items were checked, and a score near 0 means almost all of them were. Charts group scores into rough bands, but those bands are informal and vary from site to site.
What does a high score mean?
A high score, closer to 100, means you checked fewer of the listed experiences. It does not mean you are morally better or more mature than someone with a lower score.
What does a low score mean?
A low score means you checked more of the listed experiences. It is not a failing grade and it says nothing about your character, values, or future.
Is there an official average score?
No. There is no official or scientific average. Some quiz sites publish informal averages from their own submissions, but those are self-selected and not representative of everyone.
Why do different charts label the same score differently?
Because each site creates its own bands and labels. There is no central authority that standardizes score ranges, so treat chart labels as rough descriptions, not official categories.
Does my score change over time?
Yes. As new experiences happen, your score can only stay the same or go down when you retake the same list. Retaking the test later and getting a different number is completely normal.
Is the 100-question version the original test?
No. The original 1924 Rice Thresher survey was a ten-question questionnaire. The 100-question version is a later iteration that became popular online.